A New Complication in Determining Time Since Death?

In the last few weeks, a few forensics stories have broken, each taking an odd angle on what has previously been considered a tried and true forensic practice. We’re going to look at the first of these stories today.

Determining time since death in an unwitnessed death is a crucial part of any investigation, especially if the death is suspicious. In order to obtain an alibi, investigators need to know approximately when the death occurred so they can determine a suspect’s whereabouts at that specific time.

There are multiple ways to determine recent time since death, including the extent of rigor mortis (the stiffening of the body’s muscles up to approximately 12 hours after death), lividity (the settling and pooling of blood due to gravity), and a decrease in body temperature.

The human body normally functions at 37oC/98.6oF, but after death, with the body’s process of homeostasis interrupted, the body will cool until it reaches the temperature of its surroundings. By and large, the body will cool at a rate of approximately 2oC/3.6oF for the first hour postmortem, and then 1oC/1.8oF thereafter until it reaches ambient temperature. But there are a host of other complicating factors including extreme ambient temperatures, body position, whether it is clothed, humidity levels, fat content of the body, thermal conductivity of the surface beneath the body, and any disease that might raise the body’s resting temperature at the time of death. It’s a complicated set of conditions, but the key factor is that normally a body only cools; it doesn’t warm up after death.

An interesting paper was recently published in the Journal of Forensic Medicine and Pathology detailing a case of postmortem hyperthermia—a rare occurrence where the body temperature actually rises after death. The research team followed the case of a man who died in a Czech Republic hospital from heart failure. Hospital protocol required the deceased remain on the ward for two hours after death. An hour following death, as hospital staff started to prepare the body for transport in another hour, they noticed that the body was radiating heat and started to monitor temperature. An hour and a half after death, the body hit a maximum temperature of 40.1oC/104.2oF. Four hours following death, the body was still above normal at 37.6oC/99.7oF, but it then continued to cool as expected.

The ramifications of postmortem hyperthermia are clear—if it happened following a suspicious death, it would offset the time since death estimation by a number of hours (in this case, approximately 4 hours). For instance, if a murder happened at midnight, the person found dead at 6am might be assumed to have been alive until 4am. This could have serious repercussions as the killer could have a watertight alibi for four hours after the actual time of the murder, and the window of time around the murder itself would never be questioned. Currently, there is no way to predict this drastic postmortem change in body temperature, but researchers are trying to identify circumstances that might lead to this reverse temperature cascade.

Several causes for postmortem hyperthermia have been raised. Intoxication or drug overdoses may cause it. Violent deaths leading to brain trauma giving rise to cerebral oxygen deprivation or asphyxiation can be responsible. Low voltage current electrocution, heart attack, fever, or cancer can all result in hyperthermia at the time of death which could be mistaken for postmortem hyperthermia. Researchers hope to study more cases to be able to provide additional reasons for this often mysterious condition.

So where does this leave investigators? Should they question every time since death estimate? Postmortem hyperthermia certainly raises the argument that multiple metrics are required to inform investigators of an accurate time since death. Using other physical factors is the only way to ensure that in the absence of a witness, the accurate time of a suspicious death is established, giving investigators their best chance to find the individual responsible.

Of course, the author in me automatically thought this would be a great way to muddy the waters in a fictional murder investigation. Food for thought, mystery author buddies... :)

The Privilege of Authorial Control

'Truth' by Walter Seymour Allward, the Supreme Court of Canada, Ottawa, Ontario

Ann and I are currently in the research stage of our new FBI K-9 book (#3!) and are just about to start outlining. We’re right on schedule to be writing by May 1st, aiming for a completed draft by the end of July.

I had an interesting conversation with my mother yesterday. Mom has been a bit laid up with a bum knee lately that has required more of my time than usual making sure that she could manage meals etc. Mom, in turn, has been more on top of my writing than usual, making sure that I’m staying on schedule. So, she knows more about the direction of this book than she usually does at this stage. Some of the research I’ve been doing for this book is, frankly, hard. It’s difficult material, highlighting a darker side of society, one I’ve never had any experience with personally. When we were talking about it yesterday, Mom commented on some of the movies my older brother has considered (Mychael Danna, composer for movies such as Life of Pi, Moneyball, Capote, and others), and how he’d turned some of them down when the content was particularly brutal, especially when the movie portrayed a true story.

It made me realize that I have a level of control in my art that isn’t possible in his. Yes, his music gives his movies a punch that is sometimes conveyed more emotionally than the written word, but he has no control over the story. His film compositions are strictly reactive—he scores the combined vision of the writer and the director. Conversely, authors are proactive—the story is literally in our hands.

'Justice' by Walter Seymour Allward, the Supreme Court of Canada, Ottawa, Ontario

It made me realize how lucky I am. In a world which seems increasingly uncertain and where the common person has basically no control—i.e. the current chaos in America, as well as the looming specters of Russia, Syria, North Korea—writing allows an author the privilege of being in charge. So, when my mother commented on the darkness of that major aspect of the storyline, my response was that we would have the satisfaction of seeing justice done and of good trouncing evil. Honestly, there’s enough bad in the world that I don’t need to come out of a book feeling even more downtrodden (and I’m sure other readers feel the same), let alone immersing myself in that kind of storyline for months while I’m writing it. So, we get the luxury of seeing the kind of justice we’d like to see in the world if it were a more perfect place. Now, that doesn’t mean it’s going to be a straight plot line, or that the characters will have an easy time of it—where's the fun in that?—but that just makes the win at the end that much more satisfying. It certainly is a known fact that reading tastes tend to change depending on the political/world climate. Most of the time dystopian fiction tends to flourish when the world monetary markets are stable. However, interestingly, as the American government has moved to a more authoritarian stance, dystopian novels such as 1984 and The Handmaid’s Tale have become more relevant and popular as readers are looking for parallels between the current administration and their world, and these fictional dystopian worlds of yesterday.

Where do you stand on it? Are you finding your own reading habits leaning in the direction of happier endings right now because just watching the news is enough to give you a stress-related ulcer? Or do you find comfort and relevance in dystopian worlds as we try to navigate through the uncertainty of our own times?

Photo credit: D. Gordon E. Robertson - Own work, CC BY-SA 3.0, https://commons.wikimedia.org/w/index.php?curid=9441090/ https://commons.wikimedia.org/w/index.php?curid=9441019

‘After the Plague’ – A Medieval Reconstruction

Last week we talked about how looking at past catastrophic plagues could help us prepare for a future plague. This week, we look at research done by the University of Cambridge examining medieval life following the Black Death in the 14th century. In a four-year project funded by the Wellcome Trust—the world's largest medical research charity funding research into human and animal health— their study ‘After the plague: health and history in medieval Cambridge’ cites skeletal evidence as well as DNA sequencing and isotopes to explain the health, life, and death among the poor of 14th century Cambridge. Dr. John Robb, a member of the University of Cambridge’s archeology and anthropology department, notes that there is a dearth of knowledge about the poor in medieval England as the majority of record keeping, and therefore study, has centered on the royalty and upper classes, specifically around the ownership of land .

Following the discovery of a burial ground during a renovation of the Old Divinity School of St. John’s College at Cambridge, Robb and his colleagues recovered over 400 complete skeletons from 1300 burials excavated between 2010 and 2012. The remains all date from between 1200–1400 CE and were buried in the cemetery belonging to the Hospital of Saint John the Evangelist, which stood across from the cemetery until its demolition in 1511. The hospital’s mission was to care for ‘poor scholars and other wretched persons’ which likely explains why the overwhelming majority of the remains recovered are those of men and included only a few women and children. But the poverty of the inhabitants is obvious from the burials themselves—no coffins, few bodies were shrouded, and there are almost no grave goods included with the burials. These were poor people indeed. However, researchers do not believe these were plague deaths, further strengthening the idea that the hospital cared for the poor and infirm, rather than the sick and dying.

Context 958, found in an unusual face-down burial position

Context 958, found in an unusual face-down burial position

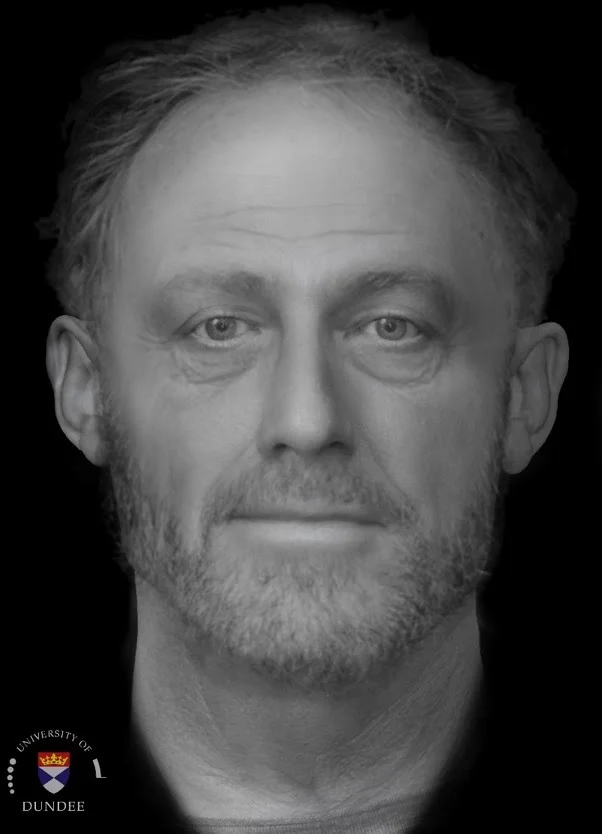
Scientists have focused on a single set of remains for more detailed examination. Given the uninteresting name of Context 958, the skeletal remains tell the story of a life of poverty and struggle. He was male and lived between 40 and 70 years (this range surprised me; between the skull sutures and the pubic symphysis, they should have been able to narrow the range from there, which indicates some skeletal weathering to me). He had fine lines in the enamel of his teeth, indicating growth interruptions due to two separate famines while he was a child. He showed additional dental disease leading to an abscess, several cavities, and a number of missing teeth. He was taller than most of his 14th century counterparts and isotope analysis of his bones illustrated a diet enriched with both meat and fish. This is quite unusual in the poorer classes of the time, who consumed mostly a grain-based diet, suggesting one of two explanations: he died and was buried below his station, or, more likely, he was involved in food trade around the university and had access to food above his station. His skeleton showed robust muscle attachments indicating a muscular build and a life of labour, also supported by significant wear in his vertebrae. He had several healed fractures: a lumbar vertebra, a rib, and a depression fracture at the back of his skull that left him with a permanent dent and likely a significant concussion. He also showed signs of gout.

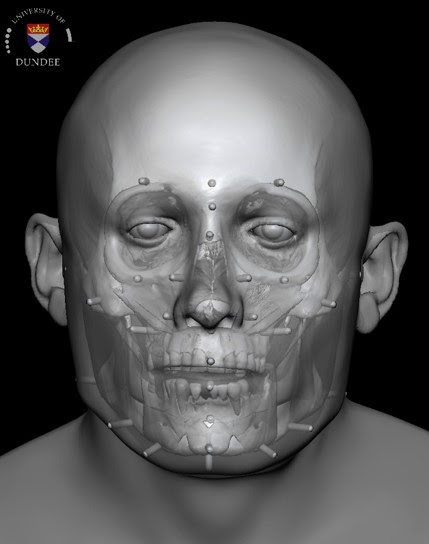
But Context 958 really came to life when the University of Dundee joined the project to build a facial reconstruction. The University of Dundee is well-known for having reconstructed the face of Richard III following the discovery of his remains. In this instance, they did a virtual 3D reconstruction of the skull of Context 958 leading to an amazingly life-like image of the face of a man dead for 800 years.

Project researchers hope that they will be able to build significantly on knowledge of the time, not only for Cambridge’s urban poor, but for all of England, telling the story of not just the rich and successful, but of the common folk who were the base of England’s prosperity and success.

Photo credit: University of Cambridge

Puzzles in the Pattern of Plague

This past weekend, my husband and I attended a lecture at my university on ‘Puzzles in the Pattern of Plague’. Being an infectious diseases specialist in my day job, and having talked about plague a number of times on the blog, the topic really caught my attention. As my husband is also a science geek, he good naturedly tagged along.

The talk was about using mathematical modeling of historic plagues to be able to predict future epidemics. And before you starting thinking Ugh, math… it was a very down to earth talk without a smidge of calculus (though you know for a fact that this kind of modelling overflows with calculus in the background), so it was fascinating from both a historical and scientific viewpoint. We’ll come back to a modern standpoint at the end as we touch on SARS and what the outbreak in 2003 might have meant for humanity.

Dr. David Earn, a mathematician at McMaster University, was the evening’s speaker. He focused on plague—bubonic, septicemic, and pneumonic—with an emphasis on the Great Plague of London from 1665.

There have been multiple waves of plague over the past two millennia:

  • Justinian, starting in 541CE and lasting 200 years.
  • Black Death (which includes the Great Plague of London), originating in China in 1334 and lasting more than 350 years, finally ending in the late 1600’s after killing over 60% of Europeans.
  • Modern plague, which started in China in 1860 before spreading to kill 2–10 million worldwide, but which finally enabled scientists of the day to isolate the responsible bacterial agent, Yersinia pestis (Y. pestis).

There are three main forms of plague known to modern man:

  • Bubonic plague—an infection of the lymphatic system by Y. pestis leading to swollen lymph nodes, or buboes. If untreated (as it was historically), the death rate is approximately 66%. Treated with modern antibiotics, the death rate is approximately 11%.
  • Pneumonic plague—a Y. pestis infection that spreads to the lungs resulting in pneumonia. Untreated, the death rate approximates 100%. Surprisingly, even with modern antibiotics, the death rate is still nearly 100%. This is the kind of plague that defense experts worry about as a bioterrorism threat. There is a vaccine, but it is extremely inefficient.
  • Septicemic plague—a Y. pestis infection which enters and spreads via the circulatory system leading to blackened and gangrenous extremities. The death rate from septicemic plague falls between that of bubonic and pneumonic plagues, but tends to approximate that of pneumonic plague even with modern treatment.

When it comes to identifying the type of plague through the ages, historians have no choice but to fall back on records of the time, which are often vague, and mostly date after the Justinian plague. However, it is clear that at least part of the second wave of plague was likely partially septicemic since it was known at the time as the Black Death, a reference to the black fingers and toes resulting from the systemic infection.

Considering the differences in plague properties, how can we be sure that the Justinian, Black Death, and modern plagues were caused by the same modern Y. pestis agent? Another McMaster researcher, Dr. Hendrik Poinar, has sequenced ancient DNA found in plague victims from both of these epidemics and has confirmed that Y. pestis was responsible for both.

So how does mathematical modelling help us use plagues of the past to possibly save us during a plague of the future? Information is power, and, in this case, knowledge of previous pandemics can help us design better control strategies for the next pandemic. This paradigm could instruct future scientists and healthcare professionals how to interrupt an epidemic just as it starts, possibly saving millions of lives in the process.

Toward this end, Dr. Earn and his students examined the Great Plague of London of 1665. They went back to the weekly bills of mortality published during that time period to collect large scale data. This is a written record of not only all the deaths broken down by cause, but also where within the 130 parishes the deaths occurred, and exactly how many were caused by plague. Based on this data, they were able to show in great detail how the plague ripped through London during the summer of 1665 and then simmered for the next year before finally disappearing at the end of 1666 following the Great Fire of London. The plague was mostly gone by the time of the fire, but actually continued for several more months, so the fire didn’t contribute to its disappearance.

London weekly mortality register, September 12 – 17, 1665 (click for a larger version)

Mathematicians use the susceptible/infectious/removed (SIR) model to infer transmission and recovery rates during an epidemic. In the SIR model

  • S = susceptible, the number of people who could be infected.
  • I = infectious, those who are infected and are capable of passing on the pathogen.
  • R = removed, those who have either recovered and are now immune, or who have died. In either case, these are the people who are now taken out of the susceptible population.

Using this SIR model, R0, the reproduction number (how contagious a pathogen is) is calculated. R0 essentially describes how many secondary cases can arise from a single primary disease case. If one sick person can spread disease to only one other person, then R0 = 1. If, on average, the disease spreads to 2 people, then R0 = 2 etc. For disease to spread through a population, R0 must be greater than zero, or there is not enough transmission to maintain the epidemic. To put this in perspective, influenza R0 = 1.5–3 and measles R0 = 17 (so get your kids vaccinated, parents! With an R0 like that, herd vaccination will only take you so far…).

Dr. Earn was able to calculate the difference between Black Death plague as it spread from Asia and through Europe in the following years: 1348, 1361, 1375, 1563, 1593, 1603, 1625, and 1665. What they found was that the R0 for plague actually rose over the centuries with an R0 = 1.1 in 1348 and an R0 = 1.5 in 1665. That translated to only 20% infection in the 14th century, but 50% infection in 1665 by the numbers. But they had to make one major assumption for this calculation: that the transmission rate in the second plague pandemic was similar to modern plague and the modern bacteria that scientists have studied. And knowing the historic death rates, Dr. Earn knew that assumption had to be incorrect since over 60% of the population was infected.

So what could account for this difference? And why did the plague spread nearly twice as fast in the 16th century, compared to the 14th century? We’ll never know for sure, but several possibilities exist:

  • The pathogen itself may have changed and become stronger through mutations that were later lost when they no longer conveyed a survival advantage.
  • Population density likely played a role as people started to live in dense clusters with close contact inside city walls.
  • Climate change of the time also played a role, as the Little Ice Age occurred between 1300–1850 in Europe.
  • What form of plague dominated at the time since bubonic had a much higher survival rate than either the septicemic or pneumonic variants.

So how does this information serve us in modern times? Dr. Earn cited the SARS pandemic of 2003 as an example. In Canada, we had 250 infections, from which 50 patients died, so a 20% mortality rate (which is quite severe in modern times with modern drugs). Worldwide, over 8,000 people were infected with 774 eventual deaths. However this pandemic could have been much worse but for a number of factors. China, the original location of the outbreak, reacted very quickly, and used extreme isolation of anyone diagnosed with SARS or who had come into contact with it. It spread through air travel to limited locations, with Canada being the next worst hit. I remember the SARS pandemic very clearly as our lab was located in the university hospital and coming to work every day included extremely long lines, written questionnaires, one-on-one health screening, and a single monitored entrance through the parking garage. But it was procedures like patient isolation and absolute dedication to stopping spread that halted the pandemic in its tracks and no infection has been seen since 2004. However, Dr. Earn calculated the SARS R0 = 2, which would have led to a 50% infection rate. In his estimation, had we not been able to control the outbreak, it would have quickly gone worldwide with over one billion dead. Simply stated, it would have changed the course of human history just as the 14th centuryplague changed the course of history after killing 50 million, just over half the population.

So this research is critically important. Mathematical models show that even if there had been a plague vaccine during the Great Plague of London that only protected 5% of the population, it would have made a significant change to the transmission curve and millions would have been saved. Using these tools, mathematicians will be able to assist during pathogen outbreaks as healthcare professionals are making decisions around treatment and vaccination and how to best protect the population and save the most lives. I’ve said for years that the bugs are going to win someday, but tools like this could stave off that fate.

Interested in more of what Dr. Earn and his team do? He gave a TEDx talk a few years ago, and this clip shows some of the fascinating animations he showed us last night about the spread of the Great Plague through the burrows of London: